Free Stock Market Course
 |
| Free Stock Market Course |
Day 1: Stock Market Basics: Financial Markets, Money Market, Capital Market/Stock Market, SEBI, BSE, NSE, Index, Sensex and Nifty
Day 2: Stock Market Basics: Investments, Speculation, Hedging and Arbitrage and Common Active Trading Strategies
Day 3: Stock Market Basics: Demat Account, Contract Note, Bonus Shares, Buy Back, Split Share, Right Share and Stock Analysis
Day 4: Technical Analysis Basics: Chart, Candle, Price, Volume, Supply and Demand, Price Trends, Trend Reversal and Support and Resistance
Day 5: Fundamental Analysis: PE Ratio, EPS, Market Cap, PB Ratio, Dividend Yield, Face Value, Beta, 52 Weeks High-Low, ROCE, ROE and Key Factors to Check in Fundamental Analysis
Day 6: Technical Analysis: Candlestick, Bull & Bear Candle, Upper & Lower Shadow, Candle Body, Popular Candlestick Patterns
Day 7: Technical Analysis: Candlestick (Doji and Star Patterns)
Day 8: Chart Patterns, Classification of Chart Patterns, Reversal Patterns
Day 9: Continuation Patterns: Triangles, Pennants, Flag, Rectangle and Cup and Handle
Day 10: Technical Indicator, Leading and Lagging, TradingView and Popular Indicators
Day 11: Technical Indicator: Moving Average: Golden Cross and Death Cross
Day 12: Technical Indicator: Volume Indicator: Using Moving Averages in Volume Indicator
Day 13: Technical Indicator: Relative Strength Index (RSI): Interpreting RSI Levels, Using RSI in Trading Strategies
Day 14: Technical Indicator: Moving Average Convergence Divergence (MACD): Interpreting MACD Signals, Practical Application
Day 15: Technical Indicator: Stochastic: Key Component of Stochastic, Practical Applications
Day 16: Technical Indicator: Bollinger Bands: Trading Signals with Bollinger Bands, Practical Tips for Using Bollinger Bands
Day 17: Technical Indicator: Pivot Points: Understanding Support and Resistance Levels, How Traders Use Pivot Points
Day 18: Technical Indicator: Aroon Indicator: Interpretation of Aroon Indicator, Application in Trading Strategies
Day 19: Technical Indicator: Average True Range (ATR): Interpreting ATR Values, Practical Applications of ATR
Day 20: Technical Indicator: Fibonacci Retracement: Understanding Fibonacci Retracement, Applications of Fibonacci Retracement
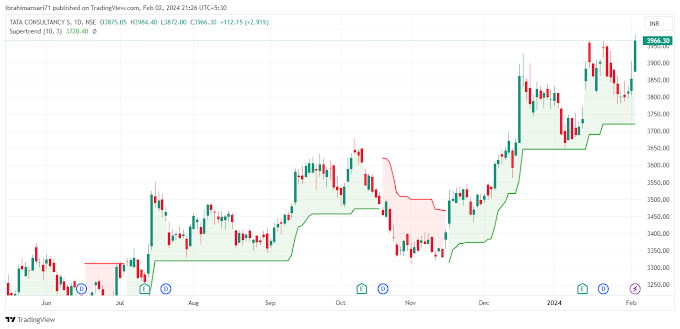
Day 21: Technical Indicator: Supertrend: Key Components of the Supertrend, Benefits of using Supertrend
Day 22: Trendlines:Types of Trendlines, Using Trendlines in Trading
Day 23: IPO Analysis: IPO Basics, Key Considerations for IPO Analysis, Trends in the Indian IPO Market
Day 24: Risk Management: Understanding Risk in Stock Market, Risk Management Strategies
Day 25: Technical Indicator: Average Directional Indicator (ADX Indicator), Using ADX for Buying & Selling of Stocks


.png)

Please do not enter any spam link in the comment box.