Free Stock Market Course (Day 22)
Trendlines
Introduction:
In the dynamic and always changing world of stock trading, investors work to identify the patterns and trends that drive market movements. Trendlines are one of the most effective and adaptable tools in a trader's toolbox for evaluating price activity and making well-informed choices. We will discuss trendlines in this blog post, as well as their importance in the stock market and how investors may use them to improve their trading tactics.
स्टॉक ट्रेडिंग की गतिशील और हमेशा बदलती दुनिया में, निवेशक उन पैटर्न और रुझानों की पहचान करने के लिए काम करते हैं जो बाजार की गतिविधियों को संचालित करते हैं। मूल्य गतिविधि का मूल्यांकन करने और अच्छी तरह से सूचित विकल्प चुनने के लिए ट्रेंडलाइन एक व्यापारी के टूलबॉक्स में सबसे प्रभावी और अनुकूलनीय उपकरणों में से एक है। हम इस ब्लॉग पोस्ट में ट्रेंडलाइन के साथ-साथ शेयर बाजार में उनके महत्व पर चर्चा करेंगे और निवेशक अपनी ट्रेडिंग रणनीति को बेहतर बनाने के लिए उनका उपयोग कैसे कर सकते हैं।
Understanding Trendlines:
An illustration of the overall direction of a stock's price movement over a given time period is called a trendline. Traders can draw a line on a chart that represents the trend, whether it is sideways (neutral), upward (bullish), or downward (bearish), by joining two or more important price points. Trendlines are primarily used by investors to determine possible points of entrance and exit as well as the general strength of a trend.
किसी निश्चित समयावधि में किसी स्टॉक की कीमत में उतार-चढ़ाव की समग्र दिशा के चित्रण को ट्रेंडलाइन कहा जाता है। व्यापारी चार्ट पर एक रेखा खींच सकते हैं जो दो या दो से अधिक महत्वपूर्ण मूल्य बिंदुओं को जोड़कर प्रवृत्ति का प्रतिनिधित्व करती है, चाहे वह पार्श्व (तटस्थ), ऊपर की ओर (तेज़ी), या नीचे की ओर (मंदी) हो। ट्रेंडलाइन का उपयोग मुख्य रूप से निवेशकों द्वारा प्रवेश और निकास के संभावित बिंदुओं के साथ-साथ एक प्रवृत्ति की सामान्य ताकत निर्धारित करने के लिए किया जाता है।
Types of Trendlines:
1. Support and Resistance Lines:
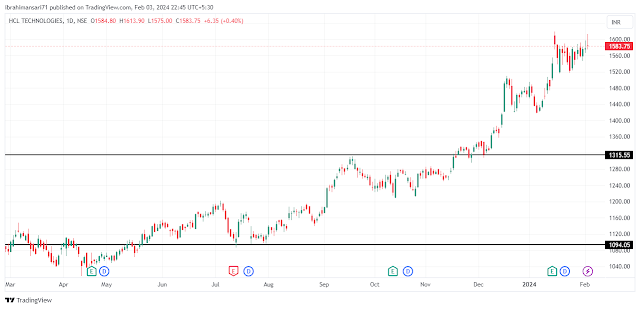
To show levels at which a stock has historically found purchasing interest and stopped falling further, support lines are put beneath the price. In order to indicate points where selling pressure has traditionally stopped upward moves, resistance lines are drawn above the price.
यह दिखाने के लिए कि किस स्तर पर किसी स्टॉक ने ऐतिहासिक रूप से खरीदारी में दिलचस्पी दिखाई है और आगे गिरना बंद कर दिया है, कीमत के नीचे समर्थन रेखाएं लगाई जाती हैं। उन बिंदुओं को इंगित करने के लिए जहां बिक्री के दबाव ने परंपरागत रूप से ऊपर की ओर बढ़ना बंद कर दिया है, प्रतिरोध रेखाएं कीमत के ऊपर खींची जाती हैं।
 |
| Support and Resistance Lines |
2. Uptrend and Downtrend Lines:
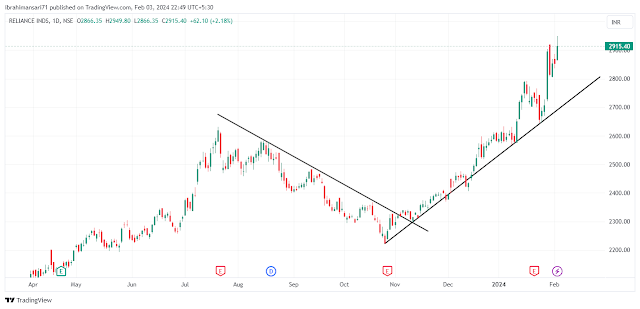
A sequence of higher lows are connected by an uptrend line, signifying a bullish sentiment in the market. A downward trend line, which indicates a pessimistic outlook for the market, joins a string of lower highs.
उच्चतर चढ़ावों का क्रम एक अपट्रेंड लाइन से जुड़ा होता है, जो बाजार में तेजी की भावना को दर्शाता है। एक नीचे की ओर प्रवृत्ति रेखा, जो बाज़ार के लिए निराशावादी दृष्टिकोण का संकेत देती है, निम्न ऊँचाइयों की एक श्रृंखला में शामिल हो जाती है।
 |
| Uptrend and Downtrend Lines |
Using Trendlines in Trading:
1. Identifying Trend Reversals:
When identifying possible market reversals, trendlines are essential. A change in attitude could be indicated by a break above or below an uptrend line.
संभावित बाजार उलटफेर की पहचान करते समय, ट्रेंडलाइन आवश्यक हैं। रुख में बदलाव का संकेत अपट्रेंड लाइन के ऊपर या नीचे ब्रेक से हो सकता है।
2. Confirmation of Trends:
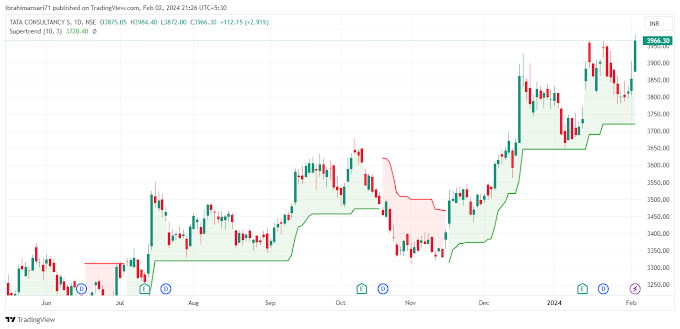
Trendlines are frequently used by traders to validate the strength of a trend. A price is more legitimate and substantial the more times it bounces off a trendline.
किसी प्रवृत्ति की ताकत को मान्य करने के लिए व्यापारियों द्वारा अक्सर ट्रेंडलाइन का उपयोग किया जाता है। एक कीमत जितनी अधिक बार ट्रेंडलाइन से उछलती है उतनी अधिक वैध और पर्याप्त होती है।
3. Setting Stop-Loss and Take-Profit Levels:
Trendlines assist traders in setting proper levels for take-profit and stop-loss. Based on the strength of the trend and past price behavior, these lines can be used as a reference to determine when to take profits or losses.
ट्रेंडलाइन्स व्यापारियों को टेक-प्रॉफिट और स्टॉप-लॉस के लिए उचित स्तर निर्धारित करने में सहायता करती हैं। प्रवृत्ति की ताकत और पिछले मूल्य व्यवहार के आधार पर, इन पंक्तियों का उपयोग यह निर्धारित करने के लिए संदर्भ के रूप में किया जा सकता है कि लाभ या हानि कब लेनी है।
4. Drawing Channels:
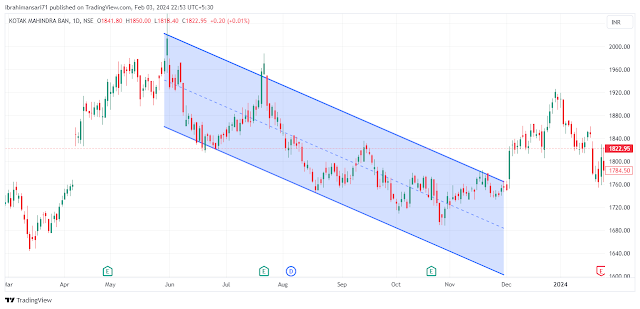
Channels that span the top and lower bounds of price movement can be made using trendlines. Trading using these channels facilitates improved decision-making and risk management.
मूल्य आंदोलन की ऊपरी और निचली सीमा तक फैले चैनल ट्रेंडलाइन का उपयोग करके बनाए जा सकते हैं। इन चैनलों का उपयोग करके व्यापार करने से निर्णय लेने और जोखिम प्रबंधन में सुधार की सुविधा मिलती है।
Conclusion:
Trendlines show themselves to be a dependable and useful resource for traders trying to make well-informed judgments in the volatile realm of the stock market. Investors can predict possible reversals, improve their overall trading techniques, and have a greater understanding of market trends by being familiar with the many types of trendlines and incorporating them into their analysis. Although trendlines are not infallible, they can be an effective tool in any trader's toolbox when combined with other technical analysis tools and a thorough risk management strategy. Thus, whether you're a seasoned investor or a beginner, think about using trendlines to help you confidently negotiate the intricacies of the stock market.
स्टॉक मार्केट के अस्थिर क्षेत्र में अच्छी तरह से सूचित निर्णय लेने की कोशिश करने वाले व्यापारियों के लिए ट्रेंडलाइन खुद को एक भरोसेमंद और उपयोगी संसाधन साबित करती है। निवेशक संभावित उलटफेर की भविष्यवाणी कर सकते हैं, अपनी समग्र ट्रेडिंग तकनीकों में सुधार कर सकते हैं, और कई प्रकार की ट्रेंडलाइनों से परिचित होकर और उन्हें अपने विश्लेषण में शामिल करके बाजार के रुझानों की बेहतर समझ प्राप्त कर सकते हैं। हालांकि ट्रेंडलाइन अचूक नहीं हैं, अन्य तकनीकी विश्लेषण टूल और संपूर्ण जोखिम प्रबंधन रणनीति के साथ संयुक्त होने पर वे किसी भी व्यापारी के टूलबॉक्स में एक प्रभावी उपकरण हो सकते हैं। इस प्रकार, चाहे आप एक अनुभवी निवेशक हों या नौसिखिया, शेयर बाजार की पेचीदगियों पर आत्मविश्वास से बातचीत करने में मदद के लिए ट्रेंडलाइन का उपयोग करने के बारे में सोचें।


.png)

Please do not enter any spam link in the comment box.