Stock Analysis: Tata Steel Limited
 |
| Stock Analysis: Tata Steel Limited |
Introduction:
Tata Steel Limited stands as a stalwart in the global steel industry, known for its unwavering commitment to quality and innovation. In this blog post, we delve into the intricate details of Tata Steel, employing both fundamental and technical analyses to provide readers with a comprehensive understanding of the company's potential for growth and investment.
Fundamental Analysis:
1. Company Overview:
Tata Steel Limited, part of the Tata Group, is a leading global steel producer with a presence in over 50 countries. The company's diversified portfolio encompasses a wide range of steel products, from automotive to construction, making it a key player in multiple industries.
2. Financial Performance:
Examining the financial health of Tata Steel is pivotal for any potential investor. Key financial indicators such as revenue growth, profit margins, and debt-to-equity ratio shed light on the company's stability and growth potential.
3. Competitive Positioning:
Analyzing Tata Steel's competitive positioning involves evaluating market share, global presence, and strategic partnerships. Understanding how Tata Steel stacks up against competitors is crucial for gauging its ability to withstand industry challenges.
4. Industry Trends:
Tata Steel operates in a cyclical industry influenced by global economic trends. Exploring these trends, such as infrastructure spending, automotive demand, and global steel prices, provides insights into Tata Steel's future prospects.
Technical Analysis:
1. Price Trends and Patterns:
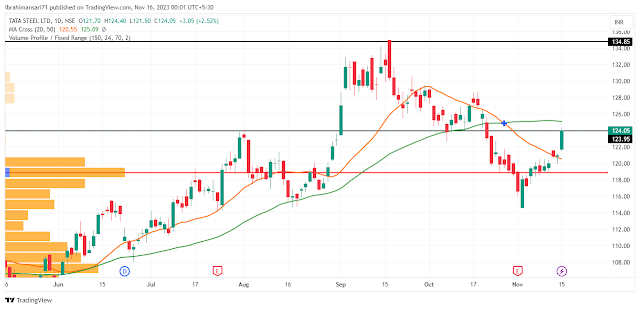
Technical analysis involves scrutinizing historical price movements and identifying patterns to predict future trends. Chart patterns like head and shoulders, double tops, and support/resistance levels can offer valuable insights into potential price movements.
2. Moving Averages:
Utilizing moving averages helps smooth out price data to identify trends more easily. The crossover of short-term and long-term moving averages can signal potential buying or selling opportunities.
3. Relative Strength Index (RSI):
RSI is a momentum indicator that gauges the speed and change of price movements. A high RSI may indicate overbought conditions, suggesting a potential reversal, while a low RSI may signal oversold conditions, indicating a potential buying opportunity.
4. Support and Resistance Levels:
Identifying key support and resistance levels helps in understanding where the stock is likely to encounter barriers. This information assists traders and investors in making informed decisions about entry and exit points.
Target & Stop Loss (for Educational Purposes only)
Target: 135
Stop Loss: 116
Conclusion:
Tata Steel Limited emerges as a compelling investment option, combining a robust fundamental foundation with promising technical indicators. As with any investment, it's crucial to conduct thorough research, considering both qualitative and quantitative factors. By merging the insights gleaned from fundamental and technical analyses, investors can make well-informed decisions and potentially unlock substantial returns in the dynamic landscape of the steel industry.


Please do not enter any spam link in the comment box.